Instrumenting HTTP server by making requests without curl
Tracing execution of entire HTTP requests in Elixir can be tricky.
The complication comes from the fact that HTTP processes are relatively short-lived, making it challenging to express a "trace all function calls in that process" desire sensibly. Because most likely that process is already mid-way through or it has been gone altogether.
Because of this complication, my typical instinct is to resort to tracing of individual "smaller" functions used during request processing, an endeavor more or less well-understood and documented.
And yet, tracing of entire HTTP processing pipeline, including controller action but also the pipeline of plugs before it could prove quite useful. For example, the application in question is a legacy one, and following execution paths by manually reviewing the code can be too time-consuming or prone to making false assumptions. In this scenario, I wish to just make a request, trace everything and study the trace to understand where the execution went and which parts of it took how long.
To put it simply, the question is: is there a function I could call, such that would accept your typical HTTP method,
path and payload, and process the HTTP request fully? Basically, this function would do the same thing as
Bandit or Cowboy web servers do when
they wrap it in a short-lived process.
Such function exists and is called Phoenix.Endpoint.call/2. Well, actually, it's rather MyApp.Endpoint.call/2
because there's rarely if ever a need to use functions from the Phoenix.Endpoint module directly.
By the virtue of implementing Plug behaviour,
Phoenix.Endpoint
exposes a function called call/2. Calling this function with correct arguments will simulate "true" processing of the
request, bypassing the "web server" to spawn a process for us. In this case "we will be that process" - a situation
allowing us to perform any set up necessary for tracing, collection of measurements, etc. - of the entire HTTP
processing pipeline.
So, what are the "correct" arguments? Let's find out by looking at an example based on
hex.pm codebase below:
# no-curl-http-request.exs

Hexpm.Repo.insert!(
  %Hexpm.Accounts.User{
    username: "username",
    full_name: "full-name",
    password: Bcrypt.hash_pwd_salt("my-password"),
    emails: [
      %Hexpm.Accounts.Email{
        email: "client@server.com",
        primary: true,
        verified: true
      }
    ]
  }
)

conn =
  Plug.Test.conn(:post, "/login", %{
    "username" => "my-username",
    "password" => "my-password"
  })

HexpmWeb.Endpoint.call(conn, [])
Code above just logs in a user. Of course, I need to create a user before attempting to log then in. Then I'm using
Plug.Test.conn/3 to build a connection struct, and passing it to
HexpmWeb.Endpoint.call/2.
This script can be executed like this:
mix run no-curl-http-request.exs
Keep in mind that above script will produce no output on the screen since, well, we're not really outputting anything.
But typically I am not that interested in measuring login action. I am more interested in "beefier" controller actions, those doing more work but also more interesting work. This is going to be a contrieved example, but let's say I am interested in analyzing updating a profile.
Because calling HexpmWeb.Endpoint.call(conn, []) will run any and all plugs along the way towards profile update
action, my request must be authenticated. And while in principle I could find my way to generation a session cookie,
I'll just re-use the login code above.
For a full example below, I will make a couple of modifications:
-
rely on a unix timestamp
tsvariable to avoid potential username/email uniqueness errors and make the script easily re-runnable, -
install and use
eflamblepackage.
Here's how a complete script looks like:
# no-curl-http-request.exs
ts = DateTime.utc_now() |> DateTime.to_unix()

Hexpm.Repo.insert!(
  %Hexpm.Accounts.User{
    username: "username-#{ts}",
    full_name: "full-name",
    password: Bcrypt.hash_pwd_salt("my-password"),
    emails: [
      %Hexpm.Accounts.Email{
        email: "client-#{ts}@server.com",
        primary: true,
        verified: true
      }
    ]
  }
)

# First, login user to get a session cookie
[session_cookie] =
  Plug.Test.conn(:post, "/login", %{"username" => "username-#{ts}", "password" => "my-password"})
  |> HexpmWeb.Endpoint.call([])
  |> Plug.Conn.get_resp_header("set-cookie")

# Then, use the session token to build another request
conn =
  Plug.Test.conn(:post, "/dashboard/profile", %{"user" => %{"Ievgen Pyrogov"}})
  |> Plug.Conn.put_req_header("cookie", session_cookie)

# Finally, call the endpoint, while also wrapping it into an eflambe
:eflambe.apply({HexpmWeb.Endpoint, :call, [conn, []]}, [output_format: :brendan_gregg])
Running the above script will produce a file containing data for what's known as a flame chart at the current process directory, in my case:
/Users/eugene/oss/hexpm/1753389882978054-eflambe-output.bggg
Feeding this file into a speedscope app will produce this:
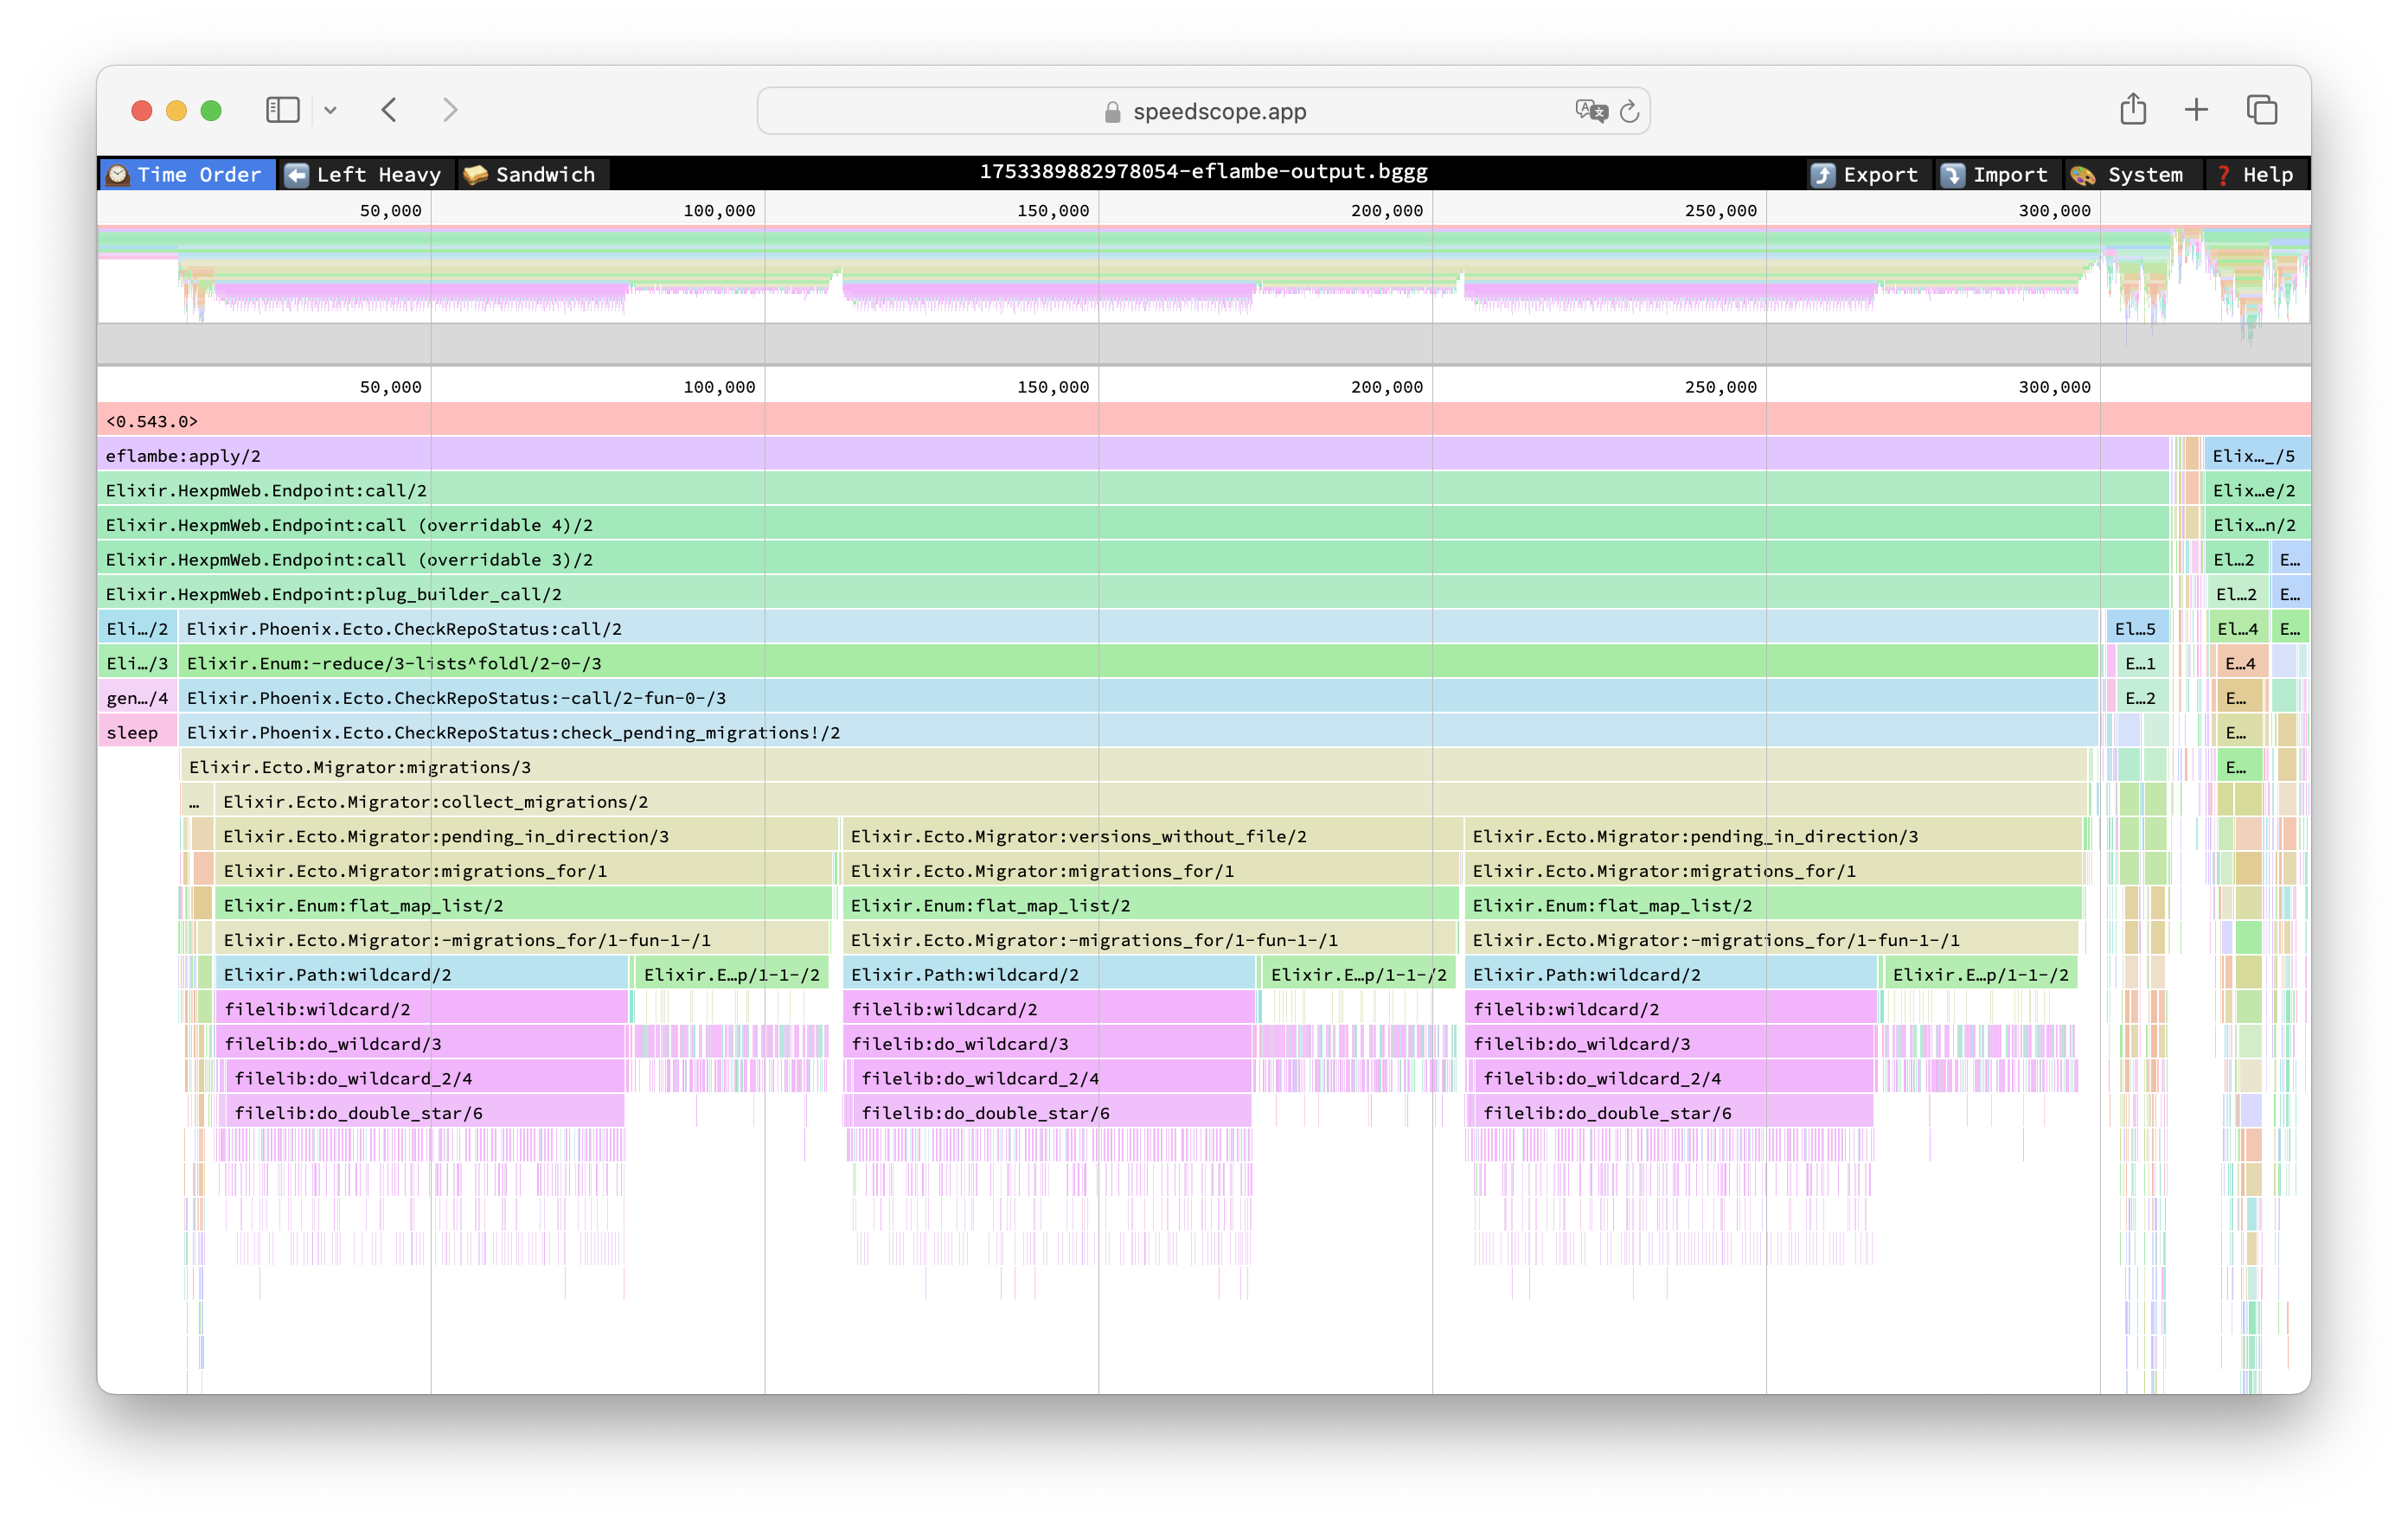
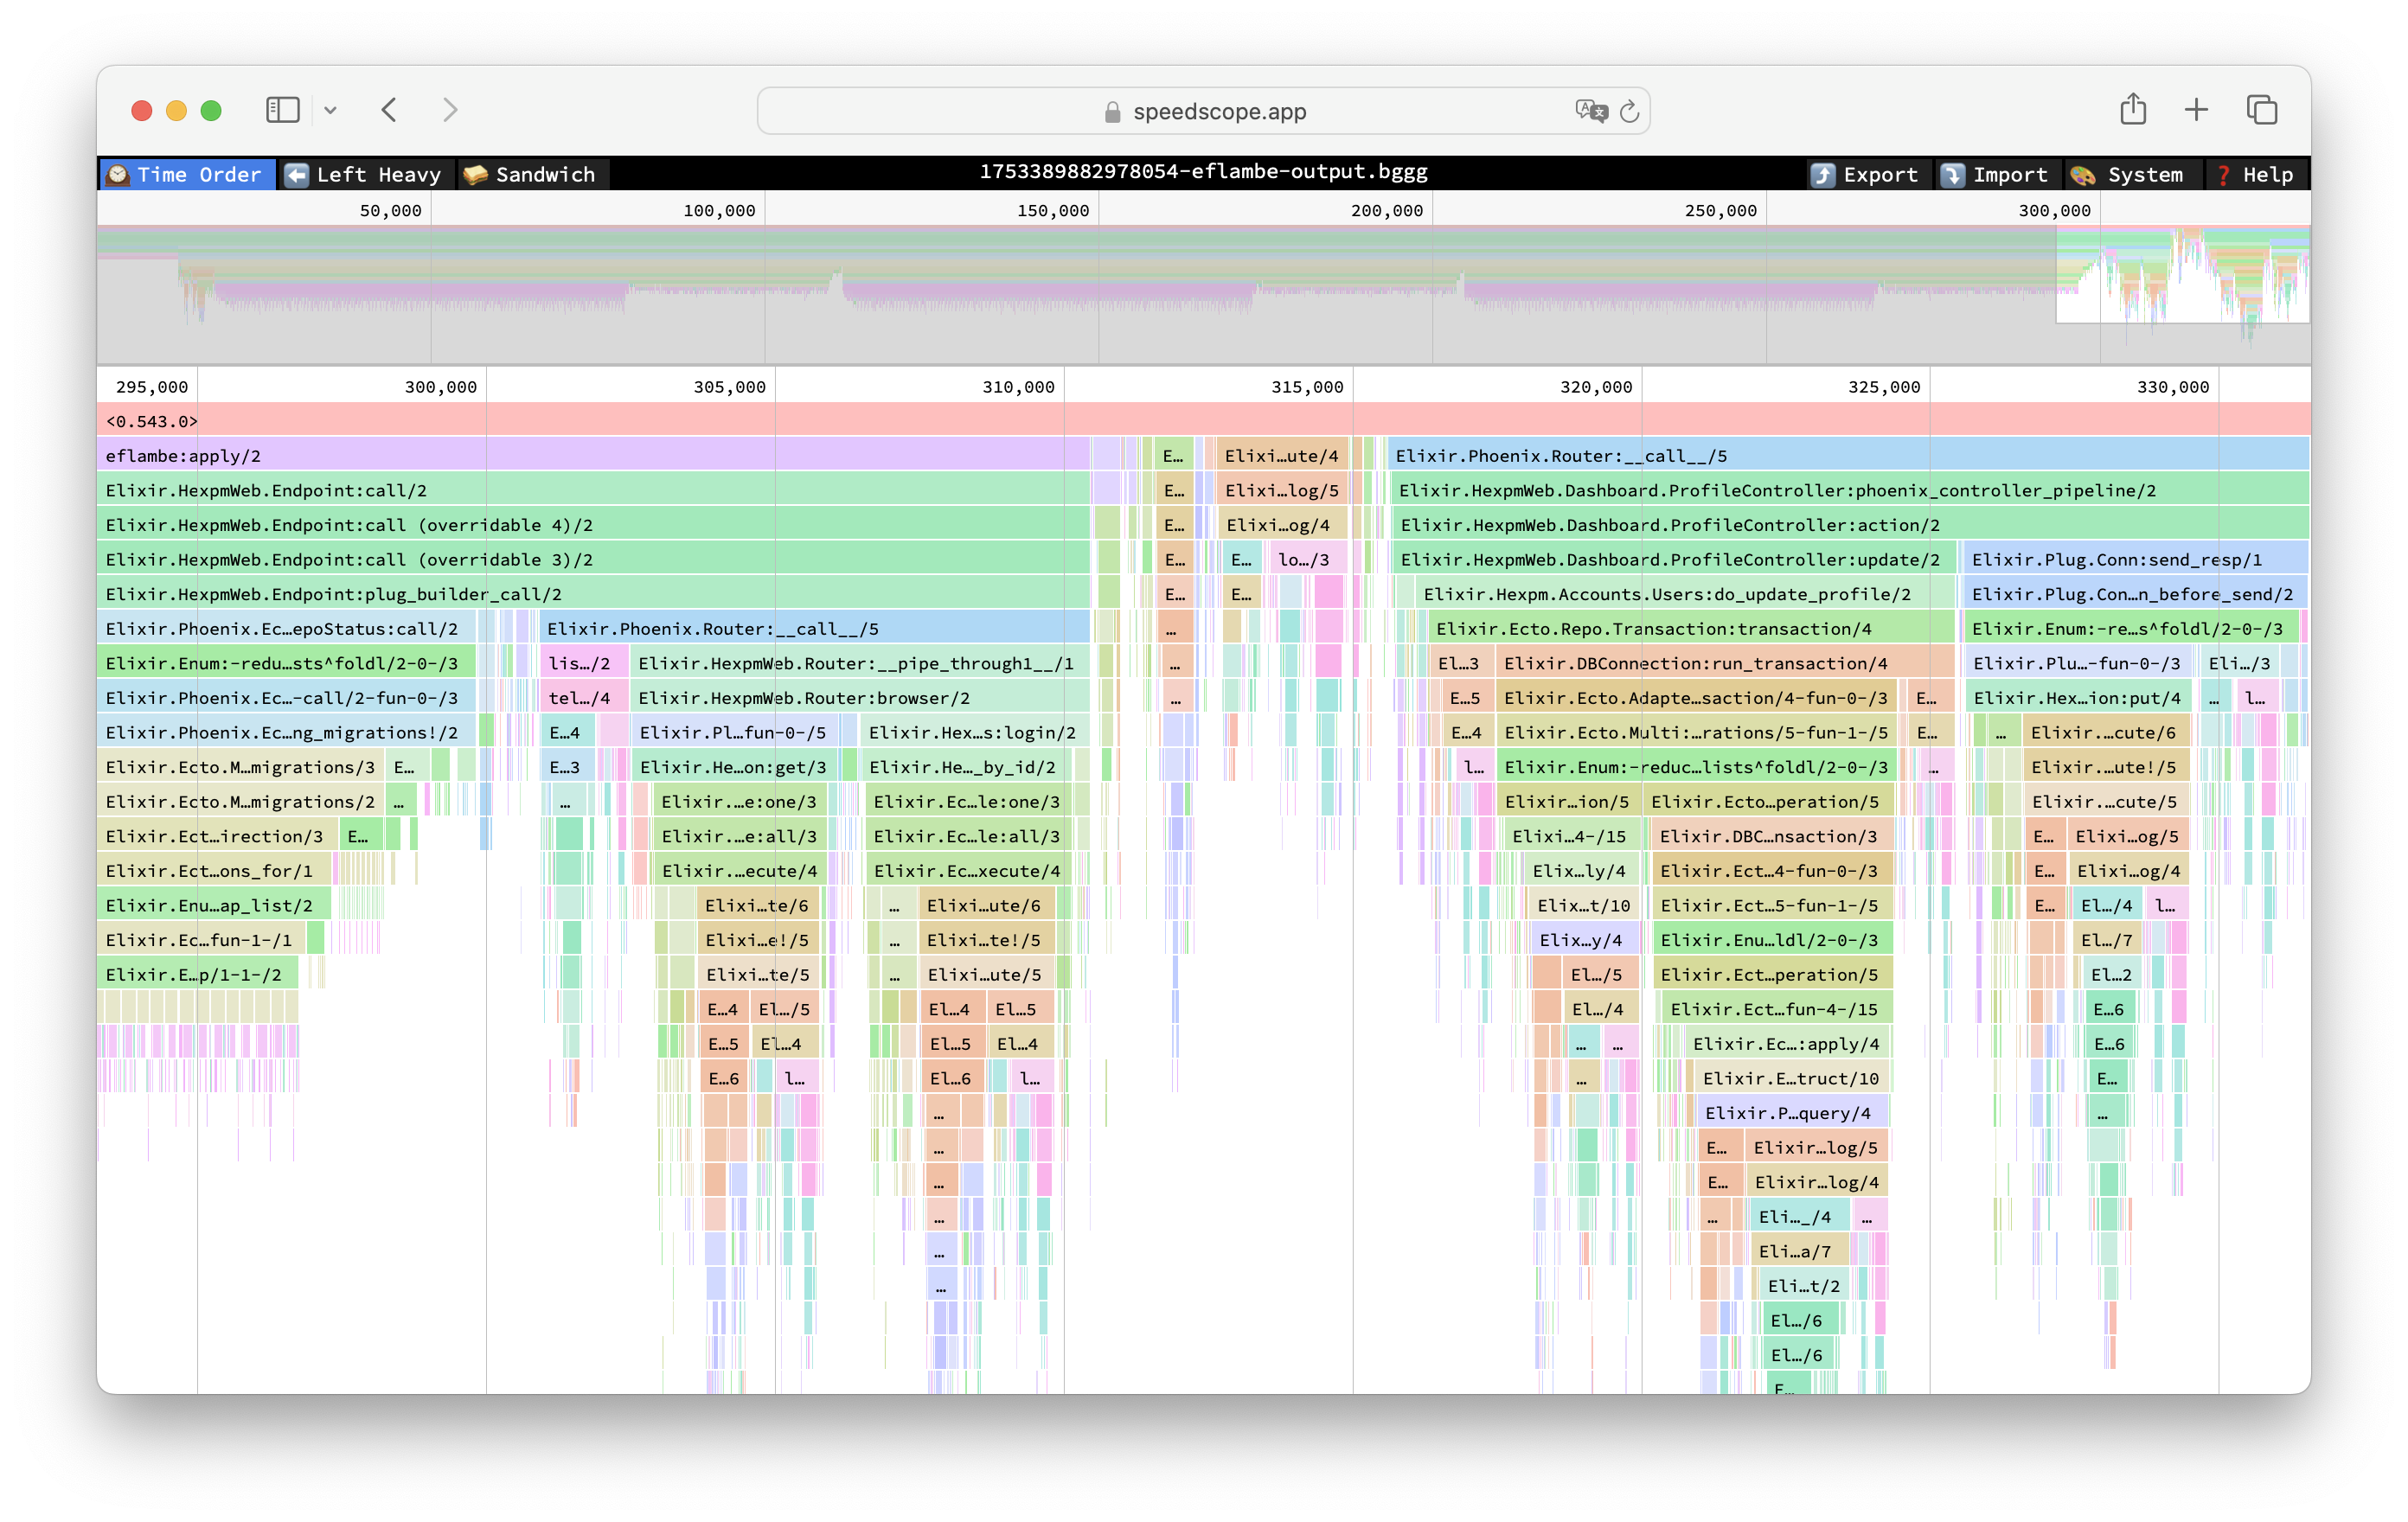
No idea what takes Phoenix so long to verify all those migrations, but hey - interesting! And zooming in the right side of the flamegraph reveals controller action, as well as router and plug bits:
The above method of course opens up more opportunities for analysis:
-
using
fprof:{:ok, tracer} = :fprof.profile(:start):fprof.trace([:start, {:tracer, tracer}])HexpmWeb.Endpoint.call(conn, []):fprof.trace(:stop):fprof.analyse([{:dest, ~c"/tmp/fprof.data"}]) -
using
tprof::tprof.profile(HexpmWeb.Endpoint, :call, [conn, []], %{type: :call_memory})
My hope for above examples is to make analyzing code for HTTP requests less painful.
Happy analyzing!